Spended three days in the last week at the PASS Business Analytics Conference in Chicago. There were several interesting seminars and discussions. Although this is not a Microsoft conference several of the speakers were from Microsoft which of course influenced the message. Form a more general point of view the message were
- Simplicity
- Insights and sencemaking
- …and of course Big Data
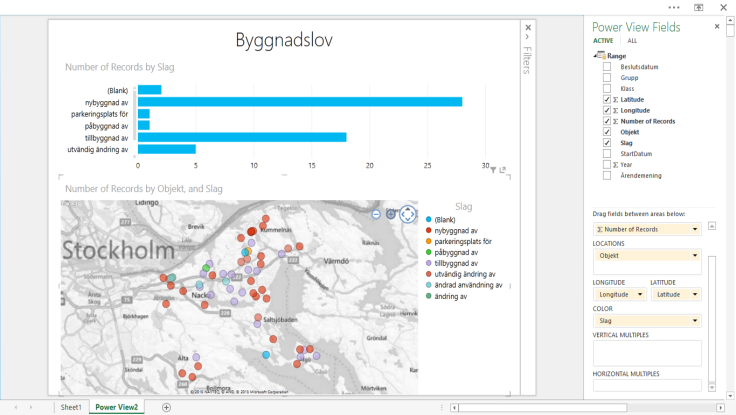
Form a product and service perspective there were a lot of demonstrations around PowerView and SharePoint and of course the public preview of codename “Geoflow”.
Simplicity
In the keynote by Amir Netz and Kamal Hathi they stressed the need of simplicity and storytelling. Amir even went so far and changed the interpretation of BI to “Basic Intelligence”.
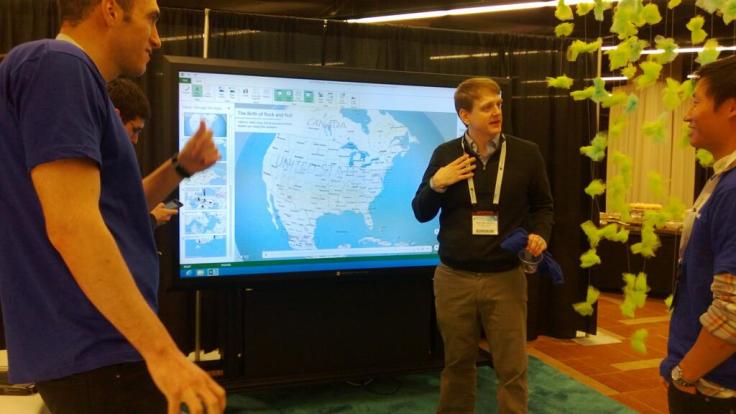
To simplify the way how information is visualized and how one can get insights from the sea of data Microsoft has introduced two new capabilities “PowerView” and “Geoflow”. PowerView should take the position as “PowerPoint” for data while Geoflow is the 3D visulazation and storytelling of geo-related information. On a very large screen Microsoft presented a really nice way of storytelling using these new functions.
Insights and sencemaking
Often one now a day hear people state that data is the new gold, currency or oil. From the perspective that it will be the flow of data that will make the wheel spin in the feature this may be true, hence data may be the unit, i.e. currency but not the value, i.e. not the gold or the oil.
The value and the IP of tomorrow will be the insights drawn from the data!
And how do you do that? The main challenged is to be able to enrich, combine and share data from both structured and unstructured sources. A very promising tool for this is “DataExplorer” where this can be done in a very simple way.
On the “insights” theme Eron Kelly gave a great presentation and ended the presentation using Geoflow to illustrate the results of the inspection of restaurants in the Chicago area.
Big data
This area is surrounded with a lot of “Buzz” and people having hard time to get a clear definition of this topic. Is it the 3 och 4 V’s? How big is “Big Data”? Can this be handled in an on-premise environment? At the end of the day this will be the “every-day” business tomorrow due to the explosion of data. So it will be extremely important to establish a strategy to handle and leverage on the massive information flow.
One of the coolest demonstrations was done by Tim Mallalieu and Faisal Mohamood when they
- used HDInsights to structure information from wheatear stations…
- …combined this with information from a spread-sheet using DataExplorer…
- …and finally visualized this using “Geoflow”
Other cases that draw my attention was how HDInsight was used by the Xbox team related to the “Halo 4” as presented by Danny Lee. He also had a great presentation on how compliance around patient data can be achieved using HDInsight.
As in many of the other scenarios Microsoft is embracing the hybrid-world and a teaser of this is the introduction of Polybase in the appliance of Parallel Data Warehouse.
I ended the three day PASS visit listening to Raman Iyer that presented Customer stories around predictive analytics. And even in the rather advance world of data mining he was able to embrace the word “simplicity” when he showed how this could be managed from Excel.

